Monthly Statistics |
||
| March 2024 | ||
 |
||
|
||
| *Marin County's local definition of Chronic Homelessness is more broad than Federal HUD guidelines, which is why our 2022 Point in Time Count of 284 Chronically Homeless individuals is a smaller count and reflects those standards | ||
| Data represents Coordinated Entry efforts since October 1, 2017 and were updated as of April 5, 2024. |
|
||
Current EncampmentsCity of NovatoBinford Road (County of Marin and Novato)
*PLEASE NOTE - this does not represent an increase in the number of persons at Binford, but rather, a more accurate count due to increased outreach efforts, including some individuals doubled up in RVs, family members, etc.Lee Gerner Park
Hamilton Marsh
City of San RafaelMahon Creek Path
Andersen Dr at Rice Dr
Francisco Blvd West at Irwin St
Town of FairfaxPeri Park
Southern MarinRichardson Bay Regional Agency (RBRA) Waters
|
||
Former EncampmentsService Support Area, San Rafael (Closed September 2022)
Marinship, Sausalito (Closed August 2022)
|
||
| Data updated as of April 5, 2024. |
What Is Our Community Doing to Solve Homelessness?
On October 1, 2017, the County of Marin and local service providers launched a national best practice for solving homelessness called Coordinated Entry. Coordinated Entry is all about collaboration. Today, local service providers gather information through a standardized assessment and data sharing process that helps to ensure efficient care coordination. This is particularly important for identifying effective housing interventions.
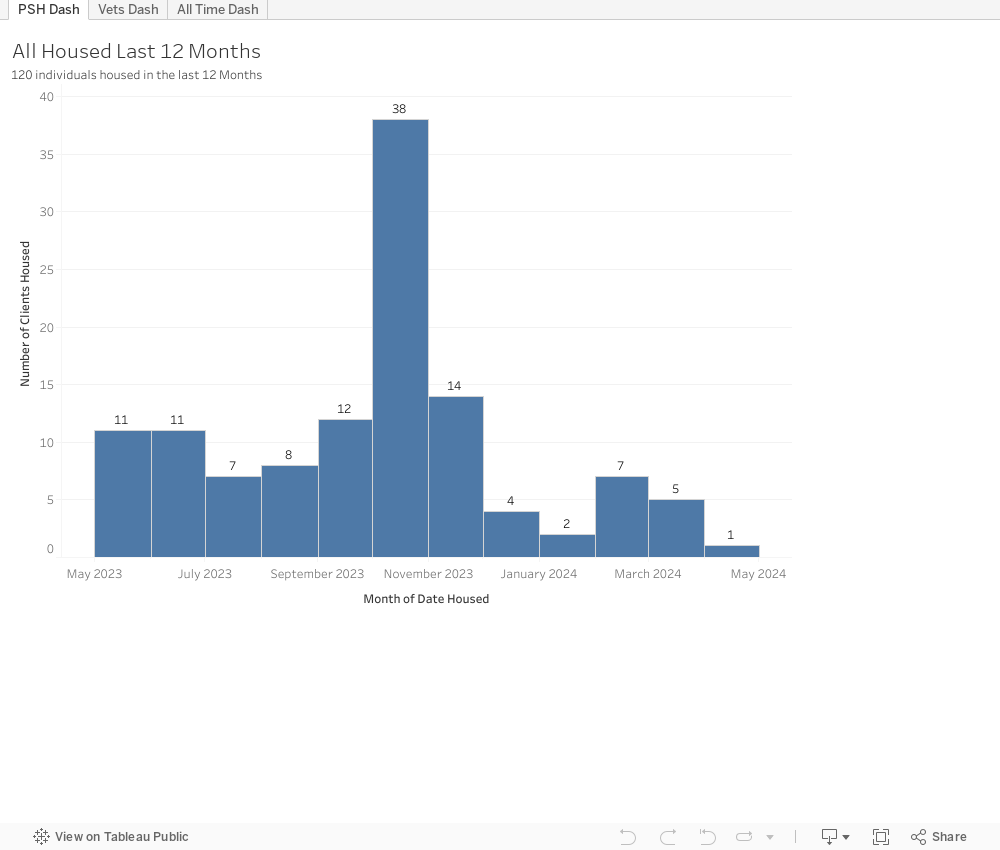
Permanent Supportive Housing is a national best practice for people experiencing long-term, chronic homelessness (i.e. homelessness lasting more than a year that is accompanied by a disabling condition such as a behavioral health diagnosis, a chronic health condition, and/or a traumatic brain injury). This chart shows the number of people housed in Permanent Supportive Housing by month.
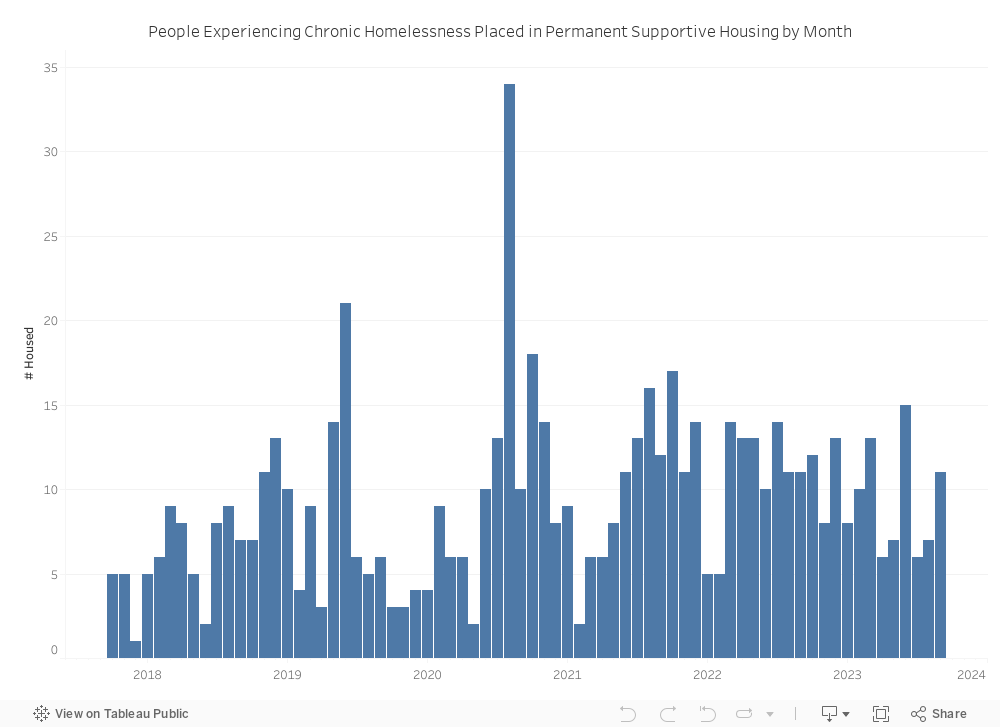
Data Source: Local Permanent Supportive Housing Data Collection System
Over 600 people were housed in the first six years of Coordinated Entry |
Permanent Supportive Housing Supply
Over time, we have worked diligently to increase not only our monthly housing placement rate, but also our supply of Permanent Supportive Housing overall. The County has a goal of increasing supply of Permanent Supportive Housing by 10% from 2021 to 2022. This means we would need 714 Permanent Supportive Housing units by the end of 2022.
This chart shows Permanent Supportive Housing units from 2016 through 2021 in Marin County and the change in the number of units from year to year. We will be posting quarterly updates on our creation of new Permanent Supportive Housing in 2022. Please find our Permanent Supportive Housing Data page for more information on inventory progress.
Data Source: Local Coordinated Entry Data Collection System
Equity in Housing
We have also been working hard to ensure that this system is equitable. Comparing demographics of people experiencing chronic homelessness to those who have obtained Permanent Supportive Housing can help us monitor our progress. The chart below shows the distribution of race/ethnicity, gender, and age of the two groups.
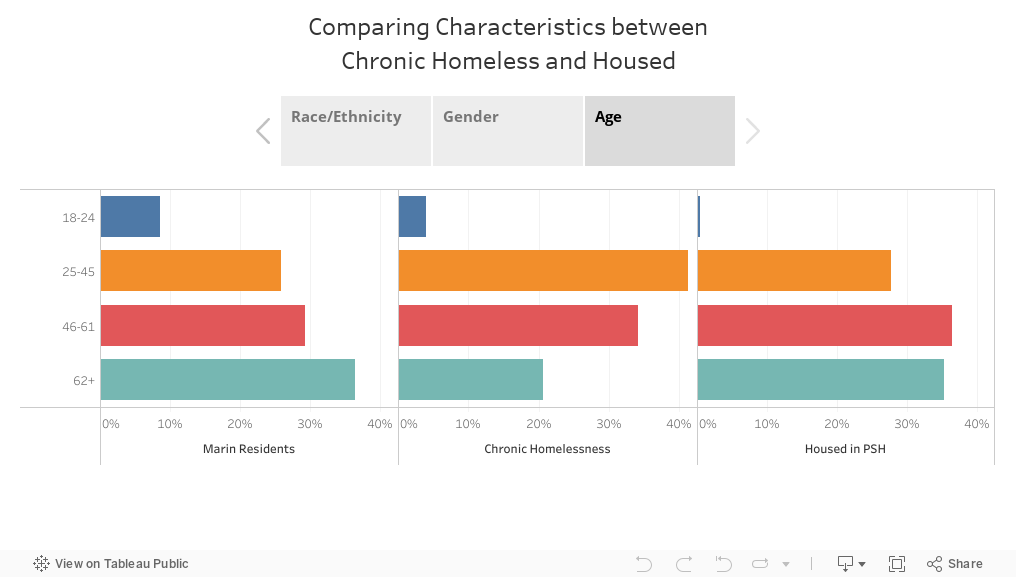
*Demographic data are based on the head of household and do not include additional household members, including partners, children, or caregivers. Data categories are based on Homeless Management Information System data elements, defined by the federal government, and may not fully capture how people self-identify. Marin resident data show Department of Finance projections of Marin's adult population and do not include non-binary genders. Data are current through September 2, 2022.
Data Sources: Local Coordinated Entry Data Collection System, Homeless Management Information System, Department of Finance
How Can Community Members Contribute?
By working together, we believe it is possible to end homelessness in our community. To learn more about how you can get involved, please visit this page.